Building an Infographic Marketing Strategy From Scratch
A step-by-step build guide for launching an infographic marketing strategy in 2012, from choosing data worth visualizing to the Pinterest-driven distribution.
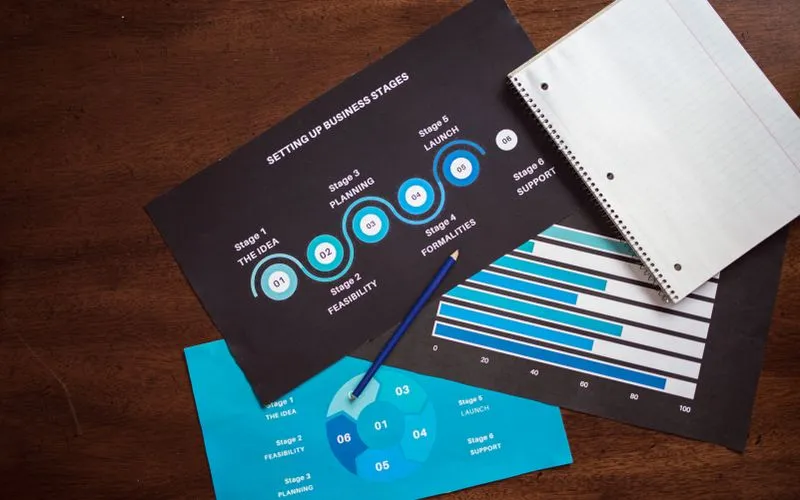
Infographics had been around for years, but 2012 is when they became a mainstream marketing tactic, driven largely by Pinterest’s explosive growth and the format’s natural fit for a platform built around vertical, shareable images. If you were starting an infographic strategy from nothing that year, here’s the order that worked.
Step 1: Find a topic worth visualizing
Not every subject makes a good infographic. The format works when there’s a genuine data story: a trend over time, a comparison between options or a process with distinct steps. Businesses that skipped this step and tried to turn a generic blog post into an infographic ended up with a decorated wall of text that shared no better than the original article.
Step 2: Source real numbers, and cite them
The infographics that earned links and shares in 2012 were built on data the creator could point to: government statistics, industry survey results or original numbers pulled from the business’s own operations. Citing sources at the bottom wasn’t optional; it was what let other sites and bloggers trust the piece enough to reference it.
Step 3: Design for readability, not decoration
Getting the design right didn’t require an in-house designer. A freelance designer hired for a single project, or one of the new self-serve tools like Piktochart, launched that year, could produce something clean. The goal was a clear visual hierarchy: a strong headline, one dominant number or insight per section and enough white space that the piece didn’t feel like a data dump.
Step 4: Build in an embed code
The single most valuable technical detail was an embed code beneath the infographic that let other websites paste it into their own posts, automatically including a credit link back to the source. This is what turned a single published piece into dozens of backlinks over time, each one a small but genuine vote of confidence from another site.
Step 5: Submit and pitch, don’t just publish
Infographic-specific directories like Visual.ly, launched the year before, gave a piece an initial audience beyond a business’s own following. Beyond directories, a short, direct pitch to bloggers and journalists who covered the relevant topic, offering the infographic as something they could run with proper credit, did more for distribution than any amount of waiting for organic discovery.
Step 6: Prioritize Pinterest specifically
Pinterest’s vertical, image-first layout was close to a perfect match for infographics, and by mid-2012 it was driving more referral traffic to some retail and lifestyle sites than Twitter and Google+ combined. An infographic sized and formatted for easy pinning, rather than a wide horizontal image built for a blog sidebar, had a real advantage in how far it traveled.
Step 7: Track backlinks and referral traffic, not just views
A view count on a hosting page said little. What mattered was counting the embed links accumulating on other sites and watching referral traffic from Pinterest and directory listings over the following months. A strong infographic kept earning both long after the initial push.
Built in that order, an infographic strategy in 2012 didn’t require a large budget. It required an interesting data story, a clean design and the patience to pitch it rather than simply hoping it would be found.